Export PowerQuery query to CSV

Recently I found a PowerQuery gem, trick with Java/VB Script that allows to export data from Power Query to CSV without R / DAX Studio / SMS and Registration. However, related with risk. As everything else in our life.

Kudos to user Shi Yang from Stack Overflow who replied to How to write to DATA sources with Power Query?.

Shi proposes to use following code (extended with my comments)

Let
     // reference to a query you wish to export to CSV
    Source = ReferenceToYourTableOrQuery,
     // demote headers to have headers in resulting CSV
     // if you don't need headers, remove Table.DemoteHeaders
     Json = Text.FromBinary(Json.FromValue(Table.ToRows(Table.DemoteHeaders(Source)))),
     // trigger execution of script
  Export = Web.Page("
 var fso=new ActiveXObject('Scripting.FileSystemObject');
 var f1=fso.CreateTextFile('C:/Temp/test.csv',true);
 var arr=" & Json & ";
 f1.WriteLine(arr.join('\n'));
 f1.WriteBlankLines(1);
 f1.Close();
 ")
 in Export

All great, but this method doesn’t work with default settings of Internet Explorer.

Continue reading

How to track refresh time in Power BI Desktop

Usually, I use Power Pivot and VBA in Excel to measure Power Query performance by comparing refresh time.

But, I suppose Power BI Desktop refresh process may be different, therefore would be nice to have something that would allow measure time between start and end of refresh.

Unfortunately, we do not have VBA in Power BI Desktop, nor can trigger and monitor refresh of Power BI Desktop from another application. So, we have only M and queries.

For the experiment I’ve created a new Power BI Desktop file, three queries in it, and put queries in order Start-Delay-End

Start

= DateTime.LocalNow()

Delay

= Function.InvokeAfter(()=> DateTime.LocalNow(), #duration(0,0,0,3))

End

= DateTime.LocalNow()

“Delay” must make a 3-seconds delay. You may read about Function.InvokeAfter in old good post from Chris Webb.

The idea is naive – hope that Power BI Desktop will execute queries in the same order as in the list of queries.

If so – query “Start” will load start time, Delay will make a pause, then “End” will load time of the end of refresh.

However, by default, Power BI Desktop loads tables in parallel, to optimize load time.

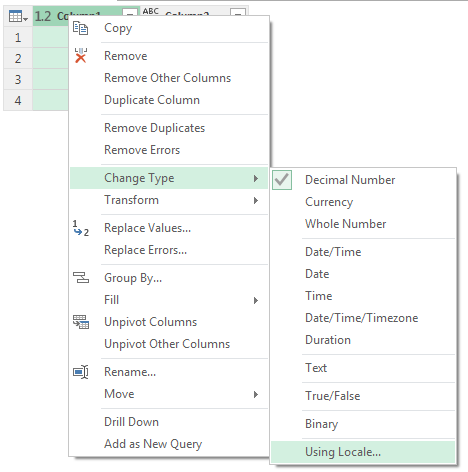
This property can be found in Options -> Current File ( Data Load ) -> Enable parallel loading of tables

This really works. I was receiving same time for Start and End tables while this property was enabled.

When I disabled it, I finally got desired difference between Start and End

Then I changed order of queries in the list of queries to check whether it impacts on execution order

Result shows that “Yes – order does matter“:

Of course, Power Query engine must be generating Execution plan when user press Refresh and then follows it. But in simple scenarios, when “Parallel loading of tables” is disabled, seems like Power BI Desktop follows order of queries from Query Editor.

I have no groups of queries, have no references between queries etc. It allowed me to check load time.

What about complex models

I tried to use same technique in more complex file – with groups of queries (but with no references).

I created query “Start” and placed it into the first group.

Similar for “End” query – but in the last group.

Result seems correct

Conclusion

Above is, of course, not a serious solution. Mainly, because you won’t want to disable parallel loading of tables, and won’t rely on order or queries.

Nevertheless, it would be good to have total refresh time directly in the model. It would allow to monitor refresh time of growing datasets.

More sophisticated way of query engine processing analysis is hidden in diagnostics of trace logs. You may read about this in several posts from Chris Webb here, here, and here.

Set of CSVs as a database for Power BI

What if part of your reporting database is a set of CSV files?

Apart from possible problems with different number of columns, data types, delimiters, encoding etc., you have to care about performance.

According to my practice, large number of files kills productivity. It is better to firstly combine CSV / TXT files into one, then use Power Query to load it.

Continue reading

Shift cells up/down in same column in Power Query

In my previous post I wrote about one interesting technique used by my colleague Zoltán Kaszaki-Krsjak.

Categoty_tmp = Table.AddColumn(Buffer, "Category_tmp", each Buffer[Category]{[ID2]}?),
// It helps to shift values of column [Category] one row upwards.

It is a trick that you most probably will not use in any of your solutions. However, worth to know how it works and how to do this without adding new columns.

“each Buffer[Category]{[ID2]}?” is just a function, so we can combine it with methods described in one of my posts (Transform Column Using Custom Function).

Here is the code.

let
Source = Excel.CurrentWorkbook(){[Name="Table1"]}[Content],
#"Duplicated Column" = Table.DuplicateColumn(Source, "Category", "Method1"),
#"Duplicated Column1" = Table.DuplicateColumn(#"Duplicated Column", "Category", "Method2"),
#"Duplicated Column2" = Table.DuplicateColumn(#"Duplicated Column1", "Category", "Method3"),
Buffer = Table.Buffer( #"Duplicated Column2" ),

Method1 = Table.FromRecords( Table.TransformRows( Buffer, each [Index = [Index],
    Category = [Category],
    Method1 = Buffer[Method1]{[Index]}?,
    Method2 = [Method2],
    Method3 = [Method3] ] ) ),

Method2 = Table.FromRecords( Table.TransformRows( Method1, (row) =>
    Record.TransformFields( row,
    {"Method2", each Buffer[Method2]{ row[Index] }? } ) ) ),
    // method offered by Miguel Escobar in comment to previous post

Method3 = Table.ReplaceValue(Method2, each [Method3], each Buffer[Method3]{[Index]}?, Replacer.ReplaceValue, {"Method3"})
in
Method3

File with methods is here.

But which method is faster?

Continue reading

Transform Column using custom function in Power Query (part 2)

Year ago I wrote a post Transform table column using own function in Power Query. According to stats, it is quite popular topic, and I’m not surprised.

However, I think that old post is quite complex and too long. Advice should be shorter.

In addition, that post do not cover another very important scenario, when you need to transform column using value from another column.

Consider following case


Task:

  1. We need to Trim column [Name]
  2. We need to divide [Amount] by [Counter] (and do not want to add additional column)

Let’s do this.

Continue reading

Decode Active Directory field UserAccountControl using Power Query

Recently my colleague had to identify inactive accounts in Active Directory and use this data in automated report on regular basis, to quickly react on new switched off users.

There are plenty of VBA solutions or Vbscripts that work with Active Directory and pull data from it.

However, for automated reports developed in Excel or Power BI it will be more convenient to use Power Query (Get & Transform) to get data directly from AD. In addition this helps to reduce mirroring of data.

Information about user status is stored in field UserAccountControl.

According to documentation on MSDN, field value is not very user friendly

“To disable a user’s account, set the UserAccountControl attribute to 0x0202 (0x002 + 0x0200). In decimal, this is 514 (2 + 512).”


Resulting value is a sum of different values of multiple properties.

E.g. what 2146 could mean?

Not easy to say when number is in decimal notation.

However, it is much easier if value of UserAccountControl is represented in binary string – of 0 and 1.

2146 = 2048 + 64 + 32 + 2 = > 100001100010

For example, if we need to check property ACCOUNTDISABLE, we only need to check second digit (from right).

Unfortunately, there is no standard function in Power Query that converts decimal number to binary notation, so I had to create own function.

As usually, it is available on Github: https://github.com/IvanBond/pquery/blob/master/Number.ToBinaryString.m

// Number.ToBinaryString( 1026 )

// result: 10000000010

Function code is quite short, although it is recursive


When number is in binary notation, we can use Text.End, Text.Start function to get needed digit.

Just an idea. Can be used with Power BI alerts to unblock self-blocked users even before they call to IT, for audit, or with Microsoft Flow somehow…

Скачать производственный календарь в Excel

Производственный календарь (или календарь рабочих и праздничных дней) – одна из важных составляющих многих отчетов и инструментов планирования.

Из-за “плавающих” выходных и праздничных дней в России мы не можем каждый год использовать один и тот же набор данных.

Лично у меня ежегодно возникает вопрос – где скачать производственный календарь. Желательно в удобном формате Excel и с наименьшими трудозатратами. И вот совсем недавно я нашёл для себя решение, которое, уверен, пригодится многим.

Continue reading

Changed Type step in Power Query

My work is connected with data coming from different countries, which have different local formats of date, numbers etc.

To be able to consolidate data in Excel models, I have to convert data accordingly.

In Power Query and Get & Transform we can set default Locale in Query Options

However, when I load data from different sources and apply Changed Type ( Table.TransformColumnTypes ) operation I must use corresponding locale for argument “culture”, which is optional.

I noticed interesting behavior. When I change type

New step “Changed Type” appears in Applied Steps without gear

Of course, when Power Query engine created this step it used default Regional Locale, which is “en-US”, as a result values are wrong. I have to use Russian locale for this sample.

When I manually add argument “culture” in formula bar – gear appears near the “Changed Type” step:

It shows nice menu – Change Type with Locale

It even shows sample format when I select Locale

Conclusion

For me it is fine to add locale manually, but when I explained this to my colleagues they were not happy to hear this.

Maybe I don’t know something… But how to call this “Change Type with Locale” by default?

E.g. when I change Data Type – ask about locale I want to use.

Probably, worth to add something like checkbox “Always ask about locale when I change data type” in the area of Current Workbook options.

Or just display gear for step Changed Type by default to let user go the and select local from list.

There is also an idea with close meaning on Power BI uservoice forum

https://ideas.powerbi.com/forums/265200-power-bi-ideas/suggestions/17155889-add-using-locale-option-to-new-data-type-menu-bu

UPD:

The option was found. Thanks to Frank and to Maxim Zelensky (@Hohlick)

change-type-right-click

To be honest, I’ve never used this menu to change type. Much faster was to change it from ribbon and from  new small button in column header, and then manually add locale.

Good to know that at least option exists, although is very hidden :-(.

Sort months by first letter in PowerPivot and Power BI

This post is a logical continuation of previous one where I described how to place measures in rows in Power BI table visual.

Here I again talk about trend tables that looks like


It displays several measures in a matrix with months, so we may see development of each measure.

Data viz gurus will say that such data must be on chart.

Right, but sometimes people want to see figures in tables and … nothing else.

One of the problems here is to display month first letters in right order. Continue reading

How to organize measures in tables horizontally in Power BI

Standard way of display measures in Power BI table visuals (Table and Matrix) – in columns.


But what if you required to display measures in rows and Year/Month in columns to see trend and remain relation with slicers and other visuals, keeping table flexible?


I couldn’t find something like Transpose table in Table/Matrix properties. And it is not possible to pull measure in rows.

In addition, required table contains rows with same value in column [KPI] – “Growth” with indent. And in different rows it has Growth of different measures.

How to do this in Power BI Desktop? Continue reading