Set of CSVs as a database for Power BI

What if part of your reporting database is a set of CSV files?

Apart from possible problems with different number of columns, data types, delimiters, encoding etc., you have to care about performance.

According to my practice, large number of files kills productivity. It is better to firstly combine CSV / TXT files into one, then use Power Query to load it.

Continue reading

Publish Excel file to PowerBI using VBA

Recently Teo Lachev released a very short but important post about Automation Excel to PowerBI publishing.

In a nutshell: now we have a VBA method PublishToPBI, which allows to publish workbooks to PowerBI.

This is quite interesting scenario for Excel-based Self-Service BI solutions.

I played around with this method, and share with you results of my experiments.

Excel VBA PublishToPBI method documentation

Unfortunately, there is no official documentation yet. At least in the list of Workbook Methods.

Below is my modest attempt.

Purpose

Publish workbook to PowerBI as a report or dataset.

Requirements

  • workbook must be saved in xlsx or xlsm format.
  • User with PowerBI license must be signed-in in Excel.
  • for publishing as a dataset – workbook must have Excel Table or Data Model.

Syntax

expression.PublishToPBI( PublishType, nameConflict, bstrGroupName )

expression a variable that represents a Workbook object.

Parameters

Name Required/Optional Data Type / Description
PublishType Optional Enum XlPublishToPBIPublishType

msoPBIExport = 0, publish workbook as a dataset. Workbook must contain Table Data (range formatted as a Table) or Data Model (aka PowerPivot model).

msoPBIUpload = 1 (default) publish workbook as a report, which can be consumed in Excel Online directly in PowerBI.

nameConflict Optional Enum XlPublishToPBINameConflictAction

msoPBIAbort = 1 (default), workbook will not be loaded to PowerBI if there already exists workbook with same full name (including extension)

msoPBIIgnore = 0, ignores existence of report / dataset and creates new one on Upload/Export.

msoPBIOverwrite = 2, overwrites existing report / dataset with same full name of workbook. Note: method raises an error if find more than one report / dataset with same full name (e.g. if msoPBIIgnore was used previously).

bstrGroupName Optional String

Name of target Workspace.

If omitted, method loads workbook to “My Workspace” of signed-in user.

Note: requires Pro-account, signed-in user must have edit rights in target workspace.

Example

' Creates Dataset from ActiveWorkbook in workspace "Finance Team" (if signed in user has access to it)
ActiveWorkbook.PublishToPBI nameConflict:=msoPBIOverwrite, bstrGroupName:="Finance Team", PublishType:=msoPBIExport
 
' Creates PowerBI Report from ActiveWorkbook in signed in user's workspace
ActiveWorkbook.PublishToPBI nameConflict:=msoPBIOverwrite, PublishType:=msoPBIUpload
 
' Creates Dataset from ActiveWorkbook in signed in user's workspace
ActiveWorkbook.PublishToPBI nameConflict:=msoPBIOverwrite, PublishType:=msoPBIExport

Some Details

Continue reading

Shift cells up/down in same column in Power Query

In my previous post I wrote about one interesting technique used by my colleague Zoltán Kaszaki-Krsjak.

Categoty_tmp = Table.AddColumn(Buffer, "Category_tmp", each Buffer[Category]{[ID2]}?),
// It helps to shift values of column [Category] one row upwards.

It is a trick that you most probably will not use in any of your solutions. However, worth to know how it works and how to do this without adding new columns.

“each Buffer[Category]{[ID2]}?” is just a function, so we can combine it with methods described in one of my posts (Transform Column Using Custom Function).

Here is the code.

let
Source = Excel.CurrentWorkbook(){[Name="Table1"]}[Content],
#"Duplicated Column" = Table.DuplicateColumn(Source, "Category", "Method1"),
#"Duplicated Column1" = Table.DuplicateColumn(#"Duplicated Column", "Category", "Method2"),
#"Duplicated Column2" = Table.DuplicateColumn(#"Duplicated Column1", "Category", "Method3"),
Buffer = Table.Buffer( #"Duplicated Column2" ),

Method1 = Table.FromRecords( Table.TransformRows( Buffer, each [Index = [Index],
    Category = [Category],
    Method1 = Buffer[Method1]{[Index]}?,
    Method2 = [Method2],
    Method3 = [Method3] ] ) ),

Method2 = Table.FromRecords( Table.TransformRows( Method1, (row) =>
    Record.TransformFields( row,
    {"Method2", each Buffer[Method2]{ row[Index] }? } ) ) ),
    // method offered by Miguel Escobar in comment to previous post

Method3 = Table.ReplaceValue(Method2, each [Method3], each Buffer[Method3]{[Index]}?, Replacer.ReplaceValue, {"Method3"})
in
Method3

File with methods is here.

But which method is faster?

Continue reading

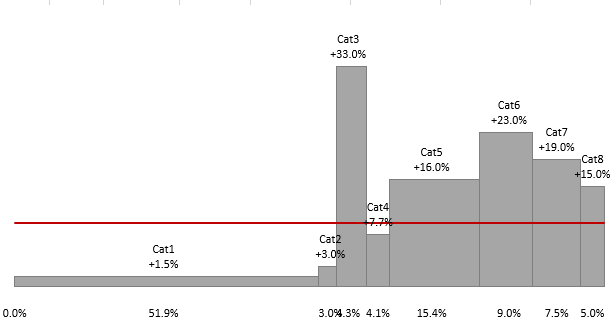
Bar-Mekko chart in Excel with Power Query

Seems, Excel charts is an area that till now wasn’t considered in blogs as a target for Power Query application (Get & Transform in Excel 2016).

Nevertheless, PQ can replace some VBA solutions and make your workbooks macro-free.

In far 2015 my colleague Zoltán Kaszaki-Krsjak shared with me a very good example of how Power Query can help with generation of specific tables for specific charts, which are widely used in our organization.

Idea to write a blog post about this technique became dusty in me OneNote, and probably would wait more if only Jon Peltier hadn’t attracted my attention to this topic again by his recent post.

Sample workbook contains a solution for Bar-Mekko chart (or “variable width column chart”)


Such chart allows to easily see share of categories, growth or absolute value. Can be used to compare market segments or productivity of departments / subsidiaries. Red line in this case shows average growth – another small but important detail.

Interested how to build it?

Continue reading

Part 2: Combination of rows of tables list in Power Query

Part 1 describes approach showing how to work with List.Generate, Table.FromRecords, List CrossJoin in Get & Transform (aka Power Query, M language).

Homework is done. Advice is digested.

And I’m ready to introduce another solution to combine multiple tables rows.

It is so simple, and can be done in UI!

All regards and honor should go to Imke Feldman (http://www.thebiccountant.com/) as she found that “epic Pokemon”.

I looked at this task as a programmer, thinking about loops and iterations.

Imke – completely differently – as simple user, don’t even thinking about programming, as she said :-).

Remind, we start from four tables

And want to mix all rows to get all possible combinations (indexed).

How to do this using UI only? Continue reading

Combination of rows of tables list in Power Query

Recently I faced interesting Power Query problem. Actually, initial problem has nothing related to Power Query.

I required to export quite big volume of data from SAP BW using Business Objects Analysis addin (BO Analysis, or BOA) and save as CSV. Amount of data is literally huge, so it was impossible to export it in one query and even in 10.

I wrote a VBA macro with a loop, where each iteration had to 1) set variables and filters 2) refresh data 3) save result as csv.

So, I had to prepare set of variables and filters for each step of loop, setting filters on several dimensions.

Following four tables describe all possible filters I needed:


Continue reading

Unfold Child-Parent hierarchy in Power Query

In this post I consider two types of hierarchies


First table defines typical hierarchy of companies.

Usually, such hierarchy is used for financial reports to group key figures.

Most probably, we know number of hierarchy levels upfront, but not always.

Task: Expand hierarchy, automatically detect quantity of levels in resulting table using Power Query (Get & Transform) / Power BI

Stay close to scenario described in pattern: http://www.daxpatterns.com/parent-child-hierarchies/

Goal:


Second table defines substitution of products.

Case: sometimes we required to get sales history of all predecessor products and group result on Actual Product. There can be multiple substitutions, we never know amount.

Task: In this case we need to find the latest successor, Actual Product for each product in other words.

Goal:


Continue reading

Refresh Excel Data Models on schedule

UPD: Excel-based version of Power Refresh (Reports Controller) is here.

I know what you think.

Yet another solution to refresh Excel files with connections and Data Model (aka PowerPivot).

Plenty of them can be found on the Internet. Different programming languages, different level of complexity

C#:

  1. https://github.com/alapolloni/ExcelRefresh
  2. Excel and PowerPivot refresh suite: https://excelrefresher.codeplex.com/

Perl: http://search.cpan.org/~ctbrown/Win32-Excel-Refresh-0.02/Refresh.pm

Power Shell: https://rpmachado.wordpress.com/2015/07/10/powershell-auto-refresh-excel-powerpivot-data/

VBA: http://velin-georgiev-blog.appspot.com/blog/fully-automated-excel-reporting-by-using-windows-task-scheduler-vba-and-simple-vba-functions-library/

And, of course – Power Update

http://exceleratorbi.com.au/power-update-software/

http://www.powerpivotpro.com/2015/02/introducing-power-update/

Year ago, when I decided to write my own refreshing program, Power Update was already on market, however, I couldn’t get it for myself, due to some reasons. In addition, I wanted to slightly adjust a process of refreshing and saving.

Continue reading

Query folding and dynamic parameters in SQL Queries in Power Query

Before you start reading this article, I recommend you to go through very good post on Ken Puls’s blog – Pass Parameters to SQL Queries.

If it is fine for you to use native queries to database then most probably scenario described below is not so interesting for you.

Here I’ll talk about workaround allowing to use query folding and pass parameters in Power Query without building of native SQL query.

Level: intermediate

Task definition

Generate N workbooks with data models populated with limited data scope.

Then each workbook will be shared with certain group of people, that allowed to see only relevant set of data (e.g. department OPEX of particular subsidiary).

This is dictated by fact, that if you share Excel workbook with someone – user immediately has access to all info inside data model. So, I cannot create one common data model and hide slicer somewhere with activated department. I must prepare separated workbooks.

Conditions

Data: Table with millions of records in SQL database – main data source for report (query folding required for obvious reasons)

Tools: Excel + Power Query + PowerPivot

Support data: table in Excel, defining datasets – data scopes, let’s call it Control Table

Continue reading

Bulk extract data from SAP Business ByDesign

Post describes how Power Query (Get & Transform) can be used as ETL tool for SAP Business ByDesign (SAP ByD).

Purely Self-Service BI solution built on Excel for SAP Business ByDesign (SAP ByD).

Level: Advanced

How to extract master and operational data from SAP ByD using Power Query

Common information can be found in my previous posts, which I’d recommend to go through

Several ways of data extraction from SAP Business ByDesign

Query SAP Business ByDesign Web Services via Power Query

From all possible methods of data extraction, I chose Excel + Power Query as the most simple one for Modern Excel data analysts (non-IT pro).

What do we need to start this journey?

What can help?

Massive data extraction from SAP ByDesign

Let’s start from the most interesting – extract of large data volume from SAP ByD.

Continue reading